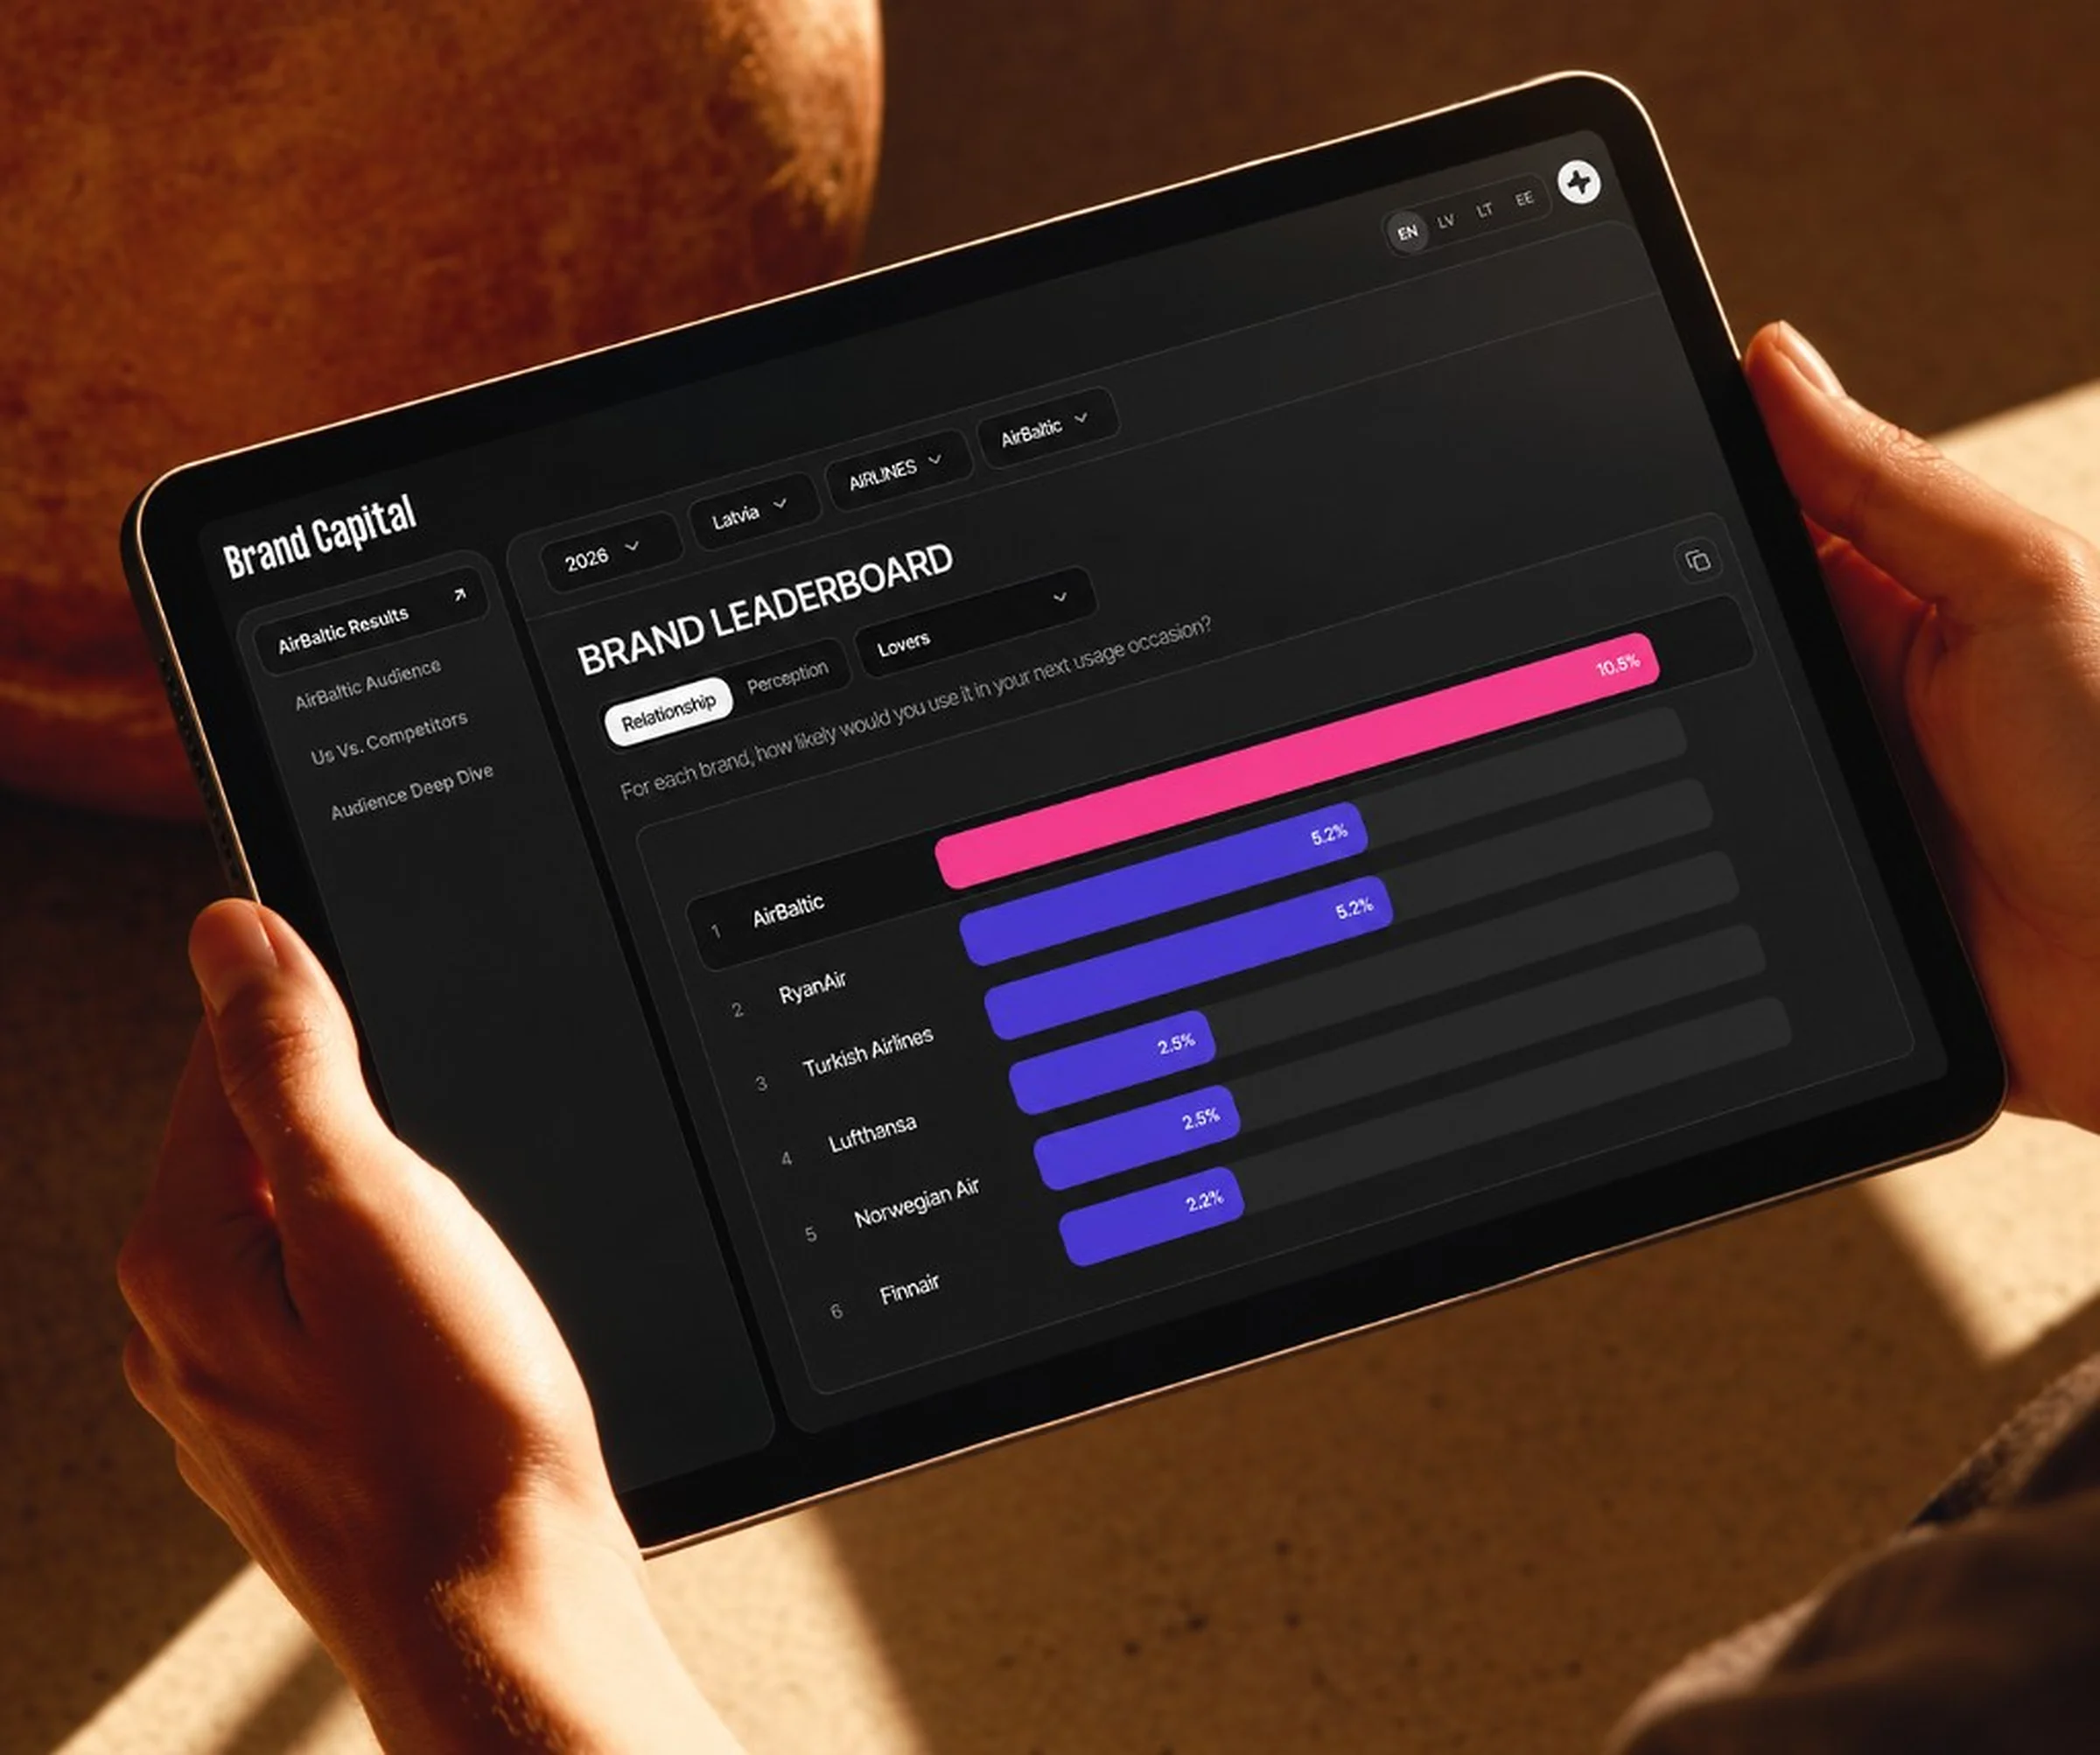
A brand-tracking report used to start with an analyst and a workbook. Open the file, hunt the right columns for that year, apply the weights, rebuild the cuts, write the deck. The next question meant another pass.
BC Tool is the workspace that does that job. A survey wave arrives as a file. It leaves as four views a brand client or an agency researcher can use without opening the raw data. Preparing a report went from 4 hours to 1.
The manual passes are where the time went. BC Tool moves them into the product. The rules get applied once, and the same question can be asked again next year.
- 75%
- less time to prepare a report
- 4 h → 1 h
- report preparation time, before and after
- 51
- categories across 3 markets and 4 survey waves
Where the four hours went
The time went into work an analyst did by hand: opening the file, hunting the right columns for that year, applying weights, rebuilding the cuts, writing the deck. The next question meant another pass.
Before the tool, the study lived in spreadsheets and static reports. A different analyst could apply a different rule and still be looking at the same study.
The file can change from wave to wave. The study covers Latvia, Lithuania, and Estonia across 51 categories, and each wave has its own column layout. A wave can shift column names, decimal marks, and which perception suffixes exist. Weights may arrive as Weights_local one year and weight_local the next, with commas where a database expects dots.
The questions do not share one calculation. Relationship is a ladder: strangers, deniers, acquaintances, friends, lovers. Each respondent sits on exactly one rung per brand, and the five shares sum to 100%. Perception is a set of phrases people can tick more than once, so those shares do not sum to 100% and must not be read as if they do. Some questions use a top-two box. Some use a frequency threshold the reader chooses. Some exist only in one country.
What the tool does instead
BC Tool keeps the method in the product and lets the person choose the question. Each step replaces one pass an analyst used to do by hand.
The aim is self-serve brand analysis for people who are not the person who built the file. The reader decides what to look at. The product decides how the number is made.
Wave import
An admin loads the workbook for a year. The importer validates the structure against that year’s map, finds the relationship and perception columns, and stores respondents and their answers in that year’s tables. The column hunt happens once per wave, at import.
Weights
One country uses the local weight. More than one country uses the global weight. The chart the reader sees is already weighted.
Relationship and perception
A relationship share is weighted respondents on that rung, divided by valid respondents. A perception share is the weighted share who selected the phrase. Changing the chip recalculates the ranking and the trend.
Audience cuts
A segment is cut against the full sample, labeled as society. Scales default to the reading researchers already use. For competitors, the same segment and the same audience section run for each brand, so a difference is a difference in people, not a difference in method.
Custom groups
Deep dive turns a question an analyst would have filtered in Excel into a saved definition: which variable, which codes, and how the conditions combine.
New waves
Each year has its own column map. The workspace does not. Adding a wave is a configuration and an import, not a redesign of the four views. A bad file can be replaced without touching the other years.
A follow-up question no longer waits on an analyst
A question that used to wait on an analyst is a change of chip, country, brand, or year. The workspace has four views.
Country, category, brand, and year stay with the person as they move. The survey wording for the selected metric stays on screen. The raw variable names stay off it.
Brand Results
Ranks every brand in the category on the metric in hand, and shows the line across years.
Brand Audience
Takes one brand’s segment, lovers by default, and sets it against everyone in the study. Demographics, attitude, activities, interests, media, and a set of specialist modules: cars, personal finance, employer branding, brand messages.
Us vs. Competitors
Keeps the same audience cuts and puts the focal brand next to the brands around it.
Audience Deep Dive
Lets a researcher build a group. Pick a question, pick the answers, join conditions with and or or, and read the brand through that slice.
Why the numbers can still be trusted
The reader can disagree with a finding. They should not have to wonder whether the percentage was built the same way as the one in last quarter’s deck. Reliability here is a calculation, not a sentence.
No invented totals
Segments on the relationship ladder are mutually exclusive. Perception phrases are not. A chart that summed them would invent a total the survey never collected.
Comparisons the survey supports
A metric appears in a year comparison only when every selected wave asked it. Humor belongs to 2023 and 2024. Relevance belongs to 2025. Distinctiveness and employer brand arrive in 2026. A 2024–2026 view will not draw likeability on one line and leave the other blank.
Weights stay in their market
A brand that was not fielded in a market does not borrow that market’s weight.
Readable labels
Labels come from the logic and the datamap, in language, not from the column code. Z01_26_3 never reaches the reader. They see the brand, the question, and the share.
Defined empty states
An empty category, a missing brand, a single-brand category, and an archived wave all have a defined empty state.
Results are not edited
Survey results are not edited to suit the chart. Admins load a wave and publish it. They do not rewrite a respondent to change a result.
Who uses it
The same engine serves two jobs: a client looking at one brand, and an agency working across the catalogue.
A brand client
Opens on their brand. Category access is a grant. They explore their audience, their competitors, and their trend. They do not browse the rest of the study.
An agency account
Explores any category, any brand, and any of the three countries, within the waves they are allowed. One workspace instead of a folder of workbooks per client.
Admins
Create accounts, assign roles, grant categories, load a wave, and publish it.
The result: 4 hours to 1
Preparing a report went from 4 hours to 1. That is 75% less time.
The passes an analyst used to do by hand now happen in the tool: finding that year’s columns, applying the weights, rebuilding the cuts. They run under one set of rules for Latvia, Lithuania, and Estonia.
A client can see where their brand sits on the ladder, who the lovers are compared with society, and how that audience differs from competitors, without commissioning a new cut. An agency can do that for any brand they are allowed to open, under the same definitions. A new wave does not create a new tool. It extends the one already in use.
The tool stays inside the study. It does not predict the future, write the questionnaire, or collect responses. The spreadsheet remains the source. It stops being the place where the decision is made.
What this project teaches
Encode the method
The time went into rules applied by hand. Self-serve works when the percentage is defined once. Top-two box, weights, mutually exclusive rungs, and year-specific questions belong in the product. The reader’s freedom is which question to ask.
The first chart is the activation moment
Activation is the first time someone experiences the value. For a reader here it is the first weighted chart with the survey wording beside it and no ticket to an analyst. Import, validation, and the logic layer exist to make that moment reliable for a client who has never seen the file.
Treat each wave as a dialect
Column layouts change. The workspace should absorb the dialect and refuse comparisons the questionnaire cannot support.
Separate the client from the catalogue
One brand, locked, is a different product from a full catalogue, even when both read the same tables. Permissions are part of the analysis, because the wrong brand on screen is a wrong result.
Add waves, not products
Four views and one logic layer are enough to carry 2023 through 2026. The next file should land in that layer.